本站所有转载资源全部来源于本站会员,仅供下载学习与参考,请勿用于商业用途,下载学习试用后请于24小时内删除,如有条件请支持正版,如有侵权请联系删除,谢谢。
资源介绍
一、通用组件使用方式
1. 引入依赖
<!DOCTYPE html>
<html>
<head>
  <meta charset="utf-8">
  <meta name="viewport" content="width=device-width">
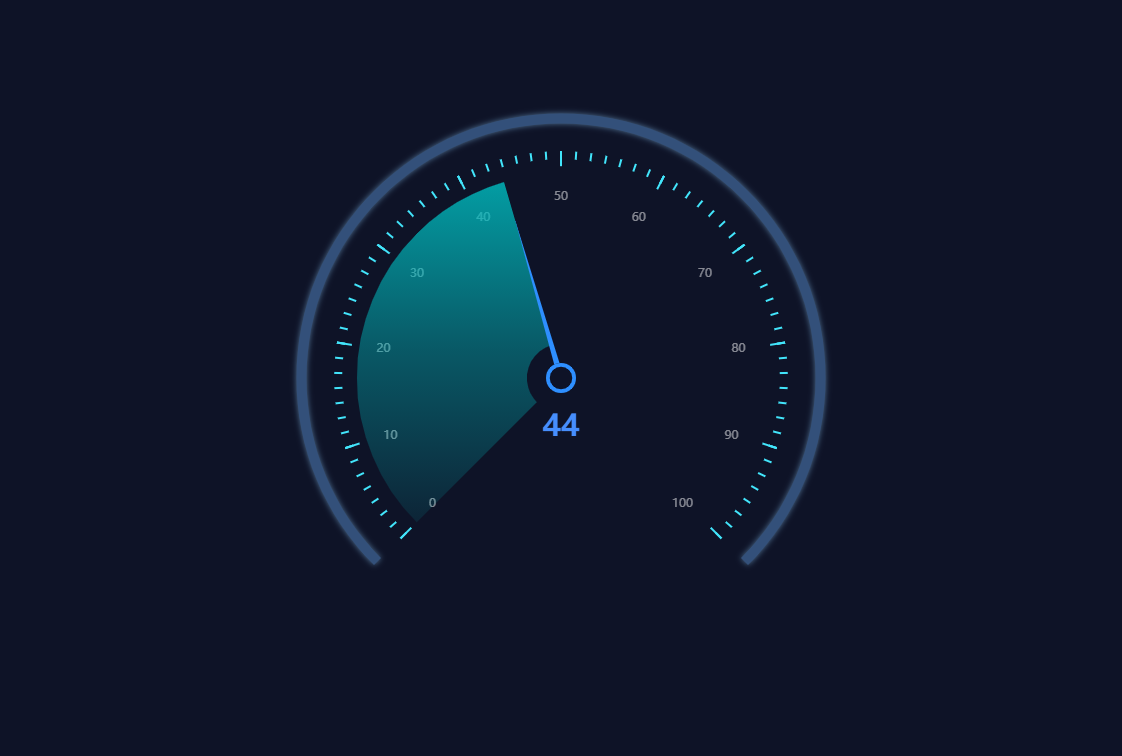
  <title>仪表盘-带刻度效果</title>
</head>
<body>
<div id="chart" style="width: 100%;height:100%;"></div>
<script src="http://cdnjs.cloudflare.com/ajax/libs/echarts/4.8.0/echarts.min.js"></script>
</body>
</html>
2. 绘制图表
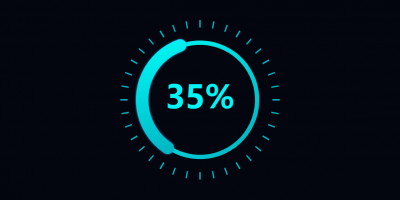
var myChart = echarts.init(document.getElementById('chart'));

var option;

var dataArr = 44;
var colorSet = {
    color: '#468EFD'
};
option = {
    backgroundColor: '#0E1327',
    tooltip: {
        formatter: "{a} <br/>{b} : {c}%"
    },

    series: [{
            name: "最外部进度条",
            type: "gauge",
            radius: '70%',
            splitNumber: 100,
            axisLine: {
                lineStyle: {
                    color: [
                        [1, '#33507A']
                    ],
                    width: 10,
                    shadowColor: 'rgba(145,207,255,.5)',
                    shadowBlur: 6,
                    shadowOffsetX: 0,
                }
            },
            axisLabel: {
                show: false,
            },
            axisTick: {
                show: false,

            },
            splitLine: {
                show: false,
            },
            itemStyle: {
                show: false,
            },
            detail: {
                show: false
            },
            title: { //标题
                show: false,
            },
            data: [{
                name: "title",
                value: dataArr,
            }],
            pointer: {
                show: false,
            },
            animationDuration: 4000,
        },
        {
            name: "内部进度条",
            type: "gauge",
            // center: ['50%', '50%'],
            radius: '54%',
            z: 4,
            splitNumber: 10,
            axisLine: {
                lineStyle: {
                    color: [
                        [dataArr / 100, new echarts.graphic.LinearGradient(
                            0, 1, 0, 0, [{
                                    offset: 0,
                                    color: 'rgba(0,191,194,.1)',
                                }, {
                                    offset: 0.5,
                                    color: 'rgba(0,191,194,0.4)',
                                },
                                {
                                    offset: 1,
                                    color: 'rgba(0,191,194,0.8)',
                                }
                            ]
                        )],
                        [
                            1, 'rgba(28,128,245,.0)'
                        ]
                    ],
                    width: 170
                }
            },
            axisLabel: {
                show: false,
            },
            axisTick: {
                show: false,

            },
            splitLine: {
                show: false,
            },
            itemStyle: {
                show: false,
            },
            detail: {
                formatter: function(value) {
                    if (value !== 0) {
                        var num = Math.round(value);
                        return parseInt(num).toFixed(0) + "";
                    } else {
                        return 0;
                    }
                },
                offsetCenter: [0, 50],
                textStyle: {
                    padding: [0, 0, 0, 0],
                    fontSize: 30,
                    fontWeight: '700',
                    color: colorSet.color
                }
            },
            title: { //标题
                show: false,
                offsetCenter: [0, 46], // x, y,单位px
                textStyle: {
                    color: "rgba(46, 143, 255, 1)",
                    fontSize: 30, //表盘上的标题文字大小
                    fontWeight: 700,
                    fontFamily: 'PingFangSC'
                }
            },
            data: [{
                name: dataArr,
                value: dataArr,
            }],
            itemStyle: {
                normal: {
                    color: 'rgba(46, 143, 255, 1)'
                }
            },
            pointer: {
                show: true,
                length: '80%',
                radius: '20%',
                width: 3, //指针粗细
            },
            animationDuration: 4000,
        },
        // 内圆
        {
            "name": '内圆',
            "type": 'pie',
            "hoverAnimation": false,
            "legendHoverLink": false,
            "radius": '4%',
            "z": 4,

            "labelLine": {
                "normal": {
                    "show": false
                }
            },
            "data": [{
                "value": 0,
            }, {
                "value": 10,

                itemStyle: {
                    normal: {
                        color: "#0E1327"
                    },
                    emphasis: {
                        color: "#0E1327"
                    }
                }
            }]
        },
        // 圆环
        {
            "name": '小圆形',
            "type": 'pie',
            "hoverAnimation": false,
            "legendHoverLink": false,
            "radius": ['4%', '3%'],
            "z": 5,
            "labelLine": {
                "normal": {
                    "show": false
                }
            },
            "data": [{
                "value": 0,
            }, {
                "value": 10,

                itemStyle: {
                    normal: {
                        color: "rgba(46, 143, 255, 1)",
                    },

                }
            }]
        },
        {
            name: '外部刻度',
            type: 'gauge',
            //  center: ['20%', '50%'],
            radius: '60%',
            min: 0, //最小刻度
            max: 100, //最大刻度
            splitNumber: 10, //刻度数量
            startAngle: 225,
            endAngle: -45,
            axisLine: {
                show: false,
                lineStyle: {
                    width: 1,
                    color: [
                        [1, 'rgba(0,0,0,0)']
                    ]
                }
            }, //仪表盘轴线
            axisLabel: {
                show: true,
                color: 'rgba(255,255,255,.5)',
                distance: 25,
                formatter: function(v) {
                    switch (v + '') {
                        case '0':
                            return '0';
                        case '10':
                            return '10';
                        case '20':
                            return '20';
                        case '30':
                            return '30';
                        case '40':
                            return '40';
                        case '50':
                            return '50';
                        case '60':
                            return '60';
                        case '70':
                            return '70';
                        case '80':
                            return '80';
                        case '90':
                            return '90';
                        case '100':
                            return '100';
                    }
                }
            }, //刻度标签。
            axisTick: {
                show: true,
                splitNumber: 7,
                lineStyle: {
                    color: '#42E5FB', //用颜色渐变函数不起作用
                    width: 2,
                },
                length: 8
            }, //刻度样式
            splitLine: {
                show: true,
                length: 15,
                lineStyle: {
                    color: '#42E5FB', //用颜色渐变函数不起作用
                }
            }, //分隔线样式
            detail: {
                show: false
            },
            pointer: {
                show: true
            }
        },
    ]
};

myChart.setOption(option);
3. 生成的Option配置
{
	"backgroundColor": "#0E1327",
	"tooltip": {
		"formatter": "{a} <br/>{b} : {c}%"
	},
	"series": [{
		"name": "最外部进度条",
		"type": "gauge",
		"radius": "70%",
		"splitNumber": 100,
		"axisLine": {
			"lineStyle": {
				"color": [
					[1, "#33507A"]
				],
				"width": 10,
				"shadowColor": "rgba(145,207,255,.5)",
				"shadowBlur": 6,
				"shadowOffsetX": 0
			}
		},
		"axisLabel": {
			"show": false
		},
		"axisTick": {
			"show": false
		},
		"splitLine": {
			"show": false
		},
		"itemStyle": {
			"show": false
		},
		"detail": {
			"show": false
		},
		"title": {
			"show": false
		},
		"data": [{
			"name": "title",
			"value": 44
		}],
		"pointer": {
			"show": false
		},
		"animationDuration": 4000
	}, {
		"name": "内部进度条",
		"type": "gauge",
		"radius": "54%",
		"z": 4,
		"splitNumber": 10,
		"axisLine": {
			"lineStyle": {
				"color": [
					[0.44, {
						"x": 0,
						"y": 1,
						"x2": 0,
						"y2": 0,
						"type": "linear",
						"global": false,
						"colorStops": [{
							"offset": 0,
							"color": "rgba(0,191,194,.1)"
						}, {
							"offset": 0.5,
							"color": "rgba(0,191,194,0.4)"
						}, {
							"offset": 1,
							"color": "rgba(0,191,194,0.8)"
						}]
					}],
					[1, "rgba(28,128,245,.0)"]
				],
				"width": 170
			}
		},
		"axisLabel": {
			"show": false
		},
		"axisTick": {
			"show": false
		},
		"splitLine": {
			"show": false
		},
		"itemStyle": {
			"normal": {
				"color": "rgba(46, 143, 255, 1)"
			}
		},
		"detail": {
			"offsetCenter": [0, 50],
			"textStyle": {
				"padding": [0, 0, 0, 0],
				"fontSize": 30,
				"fontWeight": "700",
				"color": "#468EFD"
			}
		},
		"title": {
			"show": false,
			"offsetCenter": [0, 46],
			"textStyle": {
				"color": "rgba(46, 143, 255, 1)",
				"fontSize": 30,
				"fontWeight": 700,
				"fontFamily": "PingFangSC"
			}
		},
		"data": [{
			"name": 44,
			"value": 44
		}],
		"pointer": {
			"show": true,
			"length": "80%",
			"radius": "20%",
			"width": 3
		},
		"animationDuration": 4000
	}, {
		"name": "内圆",
		"type": "pie",
		"hoverAnimation": false,
		"legendHoverLink": false,
		"radius": "4%",
		"z": 4,
		"labelLine": {
			"normal": {
				"show": false
			}
		},
		"data": [{
			"value": 0
		}, {
			"value": 10,
			"itemStyle": {
				"normal": {
					"color": "#0E1327"
				},
				"emphasis": {
					"color": "#0E1327"
				}
			}
		}]
	}, {
		"name": "小圆形",
		"type": "pie",
		"hoverAnimation": false,
		"legendHoverLink": false,
		"radius": ["4%", "3%"],
		"z": 5,
		"labelLine": {
			"normal": {
				"show": false
			}
		},
		"data": [{
			"value": 0
		}, {
			"value": 10,
			"itemStyle": {
				"normal": {
					"color": "rgba(46, 143, 255, 1)"
				}
			}
		}]
	}, {
		"name": "外部刻度",
		"type": "gauge",
		"radius": "60%",
		"min": 0,
		"max": 100,
		"splitNumber": 10,
		"startAngle": 225,
		"endAngle": -45,
		"axisLine": {
			"show": false,
			"lineStyle": {
				"width": 1,
				"color": [
					[1, "rgba(0,0,0,0)"]
				]
			}
		},
		"axisLabel": {
			"show": true,
			"color": "rgba(255,255,255,.5)",
			"distance": 25
		},
		"axisTick": {
			"show": true,
			"splitNumber": 7,
			"lineStyle": {
				"color": "#42E5FB",
				"width": 2
			},
			"length": 8
		},
		"splitLine": {
			"show": true,
			"length": 15,
			"lineStyle": {
				"color": "#42E5FB"
			}
		},
		"detail": {
			"show": false
		},
		"pointer": {
			"show": true
		}
	}]
}
END
下一篇 仪表盘-堆叠进度条效果

