本站所有转载资源全部来源于本站会员,仅供下载学习与参考,请勿用于商业用途,下载学习试用后请于24小时内删除,如有条件请支持正版,如有侵权请联系删除,谢谢。
资源介绍
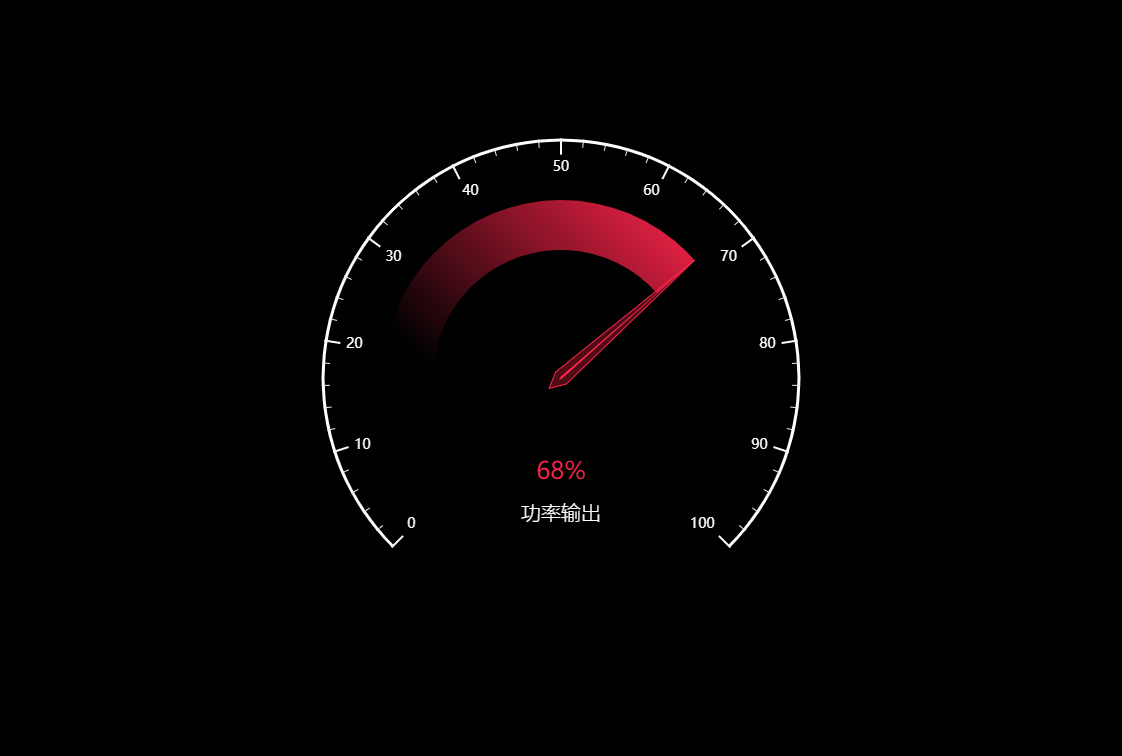
一、通用组件使用方式
1. 引入依赖
<!DOCTYPE html>
<html>
<head>
  <meta charset="utf-8">
  <meta name="viewport" content="width=device-width">
  <title>仪表盘-单值仪表盘效果</title>
</head>
<body>
<div id="chart" style="width: 100%;height:100%;"></div>
<script src="http://cdnjs.cloudflare.com/ajax/libs/echarts/4.8.0/echarts.min.js"></script>
</body>
</html>
2. 绘制图表
var myChart = echarts.init(document.getElementById('chart'));

var option;

var demoData = [{
    name: '功率输出',
    unit: '%',
    value: 68,
}, ];
option = {
    backgroundColor: '#010101',
    series: (function() {
        var result = [];

        demoData.forEach(function(item) {
            result.push(
                {
                name: item.name,
                type: 'gauge',
                radius: '47.10%',
                startAngle: 225,
                endAngle: -45,
                min: 0,

                max: 100,
                axisLine: {
                    show: true,
                    lineStyle: {
                        width: 50,
                        color: [
                            [
                                item.value / 100, new echarts.graphic.LinearGradient(
                                    0, 1, 1, 0, [{
                                            offset: 0,
                                            color: 'rgba(255, 36, 74,0)',
                                        }, {
                                            offset: 0.3,
                                            color: 'rgba(255, 36, 74,0)',
                                        },
                                        {
                                            offset: 1,
                                            color: 'rgba(255, 36, 74,1)',
                                        }
                                    ]
                                )
                            ],
                            [
                                1, 'rgba(255,255,255,.0)'
                            ]
                        ]
                    }
                },
                axisTick: {
                    show: 0,
                },
                splitLine: {
                    show: 0,
                },
                axisLabel: {
                    show: 0
                },
                pointer: {
                    show: true,
                    length: '100%'
                },
                detail: {
                    show: true,
                    offsetCenter: [0, '70%'],
                    textStyle: {
                        fontSize: 24,
                        color: '#ff244a'
                    },
                    formatter: [
                        '{value}' + (item.unit || ''),
                        '{name|' + item.name + '}'
                    ].join('\n'),
                    rich: {
                        name: {
                            fontSize: 20,
                            lineHeight: 60,
                            color: '#fff',
                            fontWeight: '100',
                        }
                    }
                },
                itemStyle: {
                    color: 'rgba(255, 36, 74,.3)',
                    borderColor: 'rgba(255, 36, 74,1)',
                },
                data: [{
                    value: item.value
                }]},
                {
                name: item.name,
                type: 'gauge',
                radius: '47.10%',
                startAngle: 225,
                endAngle: -45,
                min: 0,
                max: 100,
                axisLine: {
                    show: false,
                },
                axisTick: {
                    show: 0,
                },
                splitLine: {
                    show: 0,
                },
                axisLabel: {
                    show: 0
                },
                pointer: {
                    show: true,
                    width: 1,
                    length: '100%'
                },
                detail: {
                    show: false,
                },
                itemStyle: {
                    color: 'rgba(255, 36, 74,1)',
                },
                data: [{
                    value: item.value
                }]},
                {
                type: 'gauge',
                radius: '63.33%',
                splitNumber: 10,
                min: 0,
                max: 100,
                startAngle: 225,
                endAngle: -45,
                axisLine: {
                    show: true,
                    lineStyle: {
                        width: 3,
                        color: [
                            [1,
                                new echarts.graphic.LinearGradient(0, 0, 1, 0, [

                                    {
                                        offset: 0,
                                        color: '#fff'
                                    },
                                    {
                                        offset: 1,
                                        color: '#fff'
                                    }
                                ])
                            ]
                        ],
                    }
                },
                axisLabel: {
                    distance: 6,
                    textStyle: {
                        color: '#fff',
                        fontSize: '14'
                    }
                },
                splitLine: {
                show: true,
                length: 16,
                lineStyle: {
                    color: "#fff",
                }
            },
                pointer: {
                    show: 0
                },
                detail: {
                    show: 0
                }
            }, );
        });

        return result;
    })()
};

myChart.setOption(option);
3. 生成的Option配置
{
	"backgroundColor": "#010101",
	"series": [{
		"name": "功率输出",
		"type": "gauge",
		"radius": "47.10%",
		"startAngle": 225,
		"endAngle": -45,
		"min": 0,
		"max": 100,
		"axisLine": {
			"show": true,
			"lineStyle": {
				"width": 50,
				"color": [
					[0.68, {
						"x": 0,
						"y": 1,
						"x2": 1,
						"y2": 0,
						"type": "linear",
						"global": false,
						"colorStops": [{
							"offset": 0,
							"color": "rgba(255, 36, 74,0)"
						}, {
							"offset": 0.3,
							"color": "rgba(255, 36, 74,0)"
						}, {
							"offset": 1,
							"color": "rgba(255, 36, 74,1)"
						}]
					}],
					[1, "rgba(255,255,255,.0)"]
				]
			}
		},
		"axisTick": {
			"show": 0
		},
		"splitLine": {
			"show": 0
		},
		"axisLabel": {
			"show": 0
		},
		"pointer": {
			"show": true,
			"length": "100%"
		},
		"detail": {
			"show": true,
			"offsetCenter": [0, "70%"],
			"textStyle": {
				"fontSize": 24,
				"color": "#ff244a"
			},
			"formatter": "{value}%\n{name|功率输出}",
			"rich": {
				"name": {
					"fontSize": 20,
					"lineHeight": 60,
					"color": "#fff",
					"fontWeight": "100"
				}
			}
		},
		"itemStyle": {
			"color": "rgba(255, 36, 74,.3)",
			"borderColor": "rgba(255, 36, 74,1)"
		},
		"data": [{
			"value": 68
		}]
	}, {
		"name": "功率输出",
		"type": "gauge",
		"radius": "47.10%",
		"startAngle": 225,
		"endAngle": -45,
		"min": 0,
		"max": 100,
		"axisLine": {
			"show": false
		},
		"axisTick": {
			"show": 0
		},
		"splitLine": {
			"show": 0
		},
		"axisLabel": {
			"show": 0
		},
		"pointer": {
			"show": true,
			"width": 1,
			"length": "100%"
		},
		"detail": {
			"show": false
		},
		"itemStyle": {
			"color": "rgba(255, 36, 74,1)"
		},
		"data": [{
			"value": 68
		}]
	}, {
		"type": "gauge",
		"radius": "63.33%",
		"splitNumber": 10,
		"min": 0,
		"max": 100,
		"startAngle": 225,
		"endAngle": -45,
		"axisLine": {
			"show": true,
			"lineStyle": {
				"width": 3,
				"color": [
					[1, {
						"x": 0,
						"y": 0,
						"x2": 1,
						"y2": 0,
						"type": "linear",
						"global": false,
						"colorStops": [{
							"offset": 0,
							"color": "#fff"
						}, {
							"offset": 1,
							"color": "#fff"
						}]
					}]
				]
			}
		},
		"axisLabel": {
			"distance": 6,
			"textStyle": {
				"color": "#fff",
				"fontSize": "14"
			}
		},
		"splitLine": {
			"show": true,
			"length": 16,
			"lineStyle": {
				"color": "#fff"
			}
		},
		"pointer": {
			"show": 0
		},
		"detail": {
			"show": 0
		}
	}]
}
END
上一篇 仪表盘-双层仪表盘效果图

