本站所有转载资源全部来源于本站会员,仅供下载学习与参考,请勿用于商业用途,下载学习试用后请于24小时内删除,如有条件请支持正版,如有侵权请联系删除,谢谢。
资源介绍
一、通用组件使用方式
1. 引入依赖
<!DOCTYPE html>
<html>
<head>
  <meta charset="utf-8">
  <meta name="viewport" content="width=device-width">
  <title>趋势图-近6个月卡数增长趋势</title>
</head>
<body>
<div id="chart" style="width: 100%;height:100%;"></div>
<script src="http://cdnjs.cloudflare.com/ajax/libs/echarts/4.8.0/echarts.min.js"></script>
</body>
</html>
2. 绘制图表
var myChart = echarts.init(document.getElementById('chart'));

var option;

option = {
    backgroundColor:'#12193a',
	color:['#f0c725','#16f892'],
    title: {
		left: 'center',
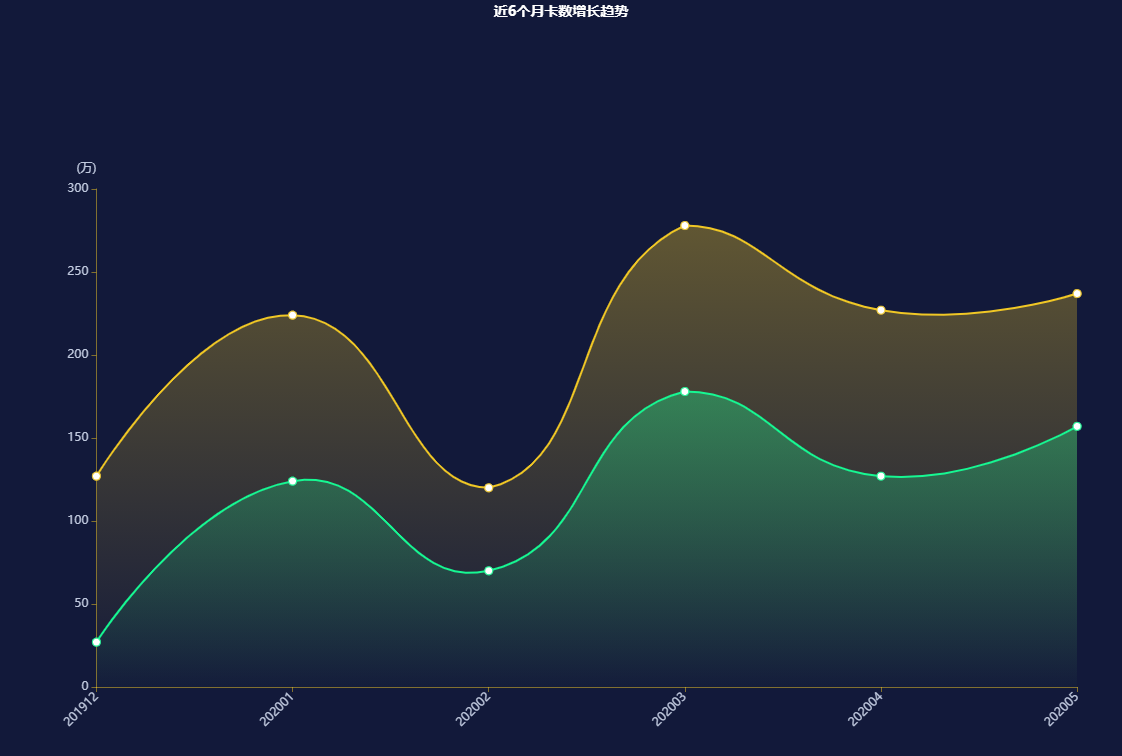
		text: '近6个月卡数增长趋势',
		textStyle:{
			color:'#FFFFFF',
			fontSize:'14',
		}
    },
    tooltip : {
        trigger: 'axis',
        axisPointer : {            // 坐标轴指示器,坐标轴触发有效
            type : 'shadow'        // 默认为直线,可选为:'line' | 'shadow'
        }
    },
    legend: {
        data:['卡数'],
        x: 'center',
		top:'25',
        textStyle: {
			color:'#c1cadf',
			"fontSize": 10
		}
    },
    grid: {
		left: '6%',
		right: '4%',
		top:'25%',
		bottom: '3%',
		containLabel: true
	},
    toolbox: {
        show : true,
        orient: 'vertical',
        x: 'right',
        y: 'center'
    },
    xAxis : [
        {
            type : 'category',
			boundaryGap: false,
            data : ['201912','202001','202002','202003','202004','202005'],
			axisLine:{
				lineStyle:{
					color:'rgba(240,199,37,0.5)'
				}
			},
            axisLabel :{
                interval:0,
				rotate:'45',
				color:'#c1cadf'
            }
        }
    ],
    yAxis : [
        {
            type : 'value',
			name: '(万)',
			nameTextStyle:{
				color:'#c1cadf',
				align:'right',
				lineHeight:10
			},
			axisLine:{
				lineStyle:{
					color:'rgba(240,199,37,0.5)'
				}
			},
            axisLabel :{
                interval:0,
				color:'#c1cadf'
            },
			splitLine: {
				show: false
			}
        }
    ],
    series : [
        {
            name:'总卡数',
            type:'line',
			smooth: true,
			symbolSize: 8,
			areaStyle: {
				color: new echarts.graphic.LinearGradient(0, 0, 0, 1, [{
					offset: 0,
					color: 'rgba(240,199,37,0.5)'
				}, {
					offset: 1,
					color: 'rgba(240,199,37,0.01)'
				}])
			},
            data:[127,224,120,278,227,237],
            barWidth: '30%',
            itemStyle:{ normal:{ color:'#f0c725' } }
        },{
            name:'使用中卡数',
            type:'line',
			smooth: true,
			symbolSize: 8,
			areaStyle: {
				color: new echarts.graphic.LinearGradient(0, 0, 0, 1, [{
					offset: 0,
					color: 'rgba(22,248,146,0.5)'
				}, {
					offset: 1,
					color: 'rgba(22,248,146,0.01)'
				}])
			},
            data:[27,124,70,178,127,157],
            barWidth: '30%',
            itemStyle:{ normal:{ color:'#16f892' } }
        }
    ]
};

myChart.setOption(option);
3. 生成的Option配置
{
    backgroundColor:'#12193a',
	color:['#f0c725','#16f892'],
    title: {
		left: 'center',
		text: '近6个月卡数增长趋势',
		textStyle:{
			color:'#FFFFFF',
			fontSize:'14',
		}
    },
    tooltip : {
        trigger: 'axis',
        axisPointer : {            // 坐标轴指示器,坐标轴触发有效
            type : 'shadow'        // 默认为直线,可选为:'line' | 'shadow'
        }
    },
    legend: {
        data:['卡数'],
        x: 'center',
		top:'25',
        textStyle: {
			color:'#c1cadf',
			"fontSize": 10
		}
    },
    grid: {
		left: '6%',
		right: '4%',
		top:'25%',
		bottom: '3%',
		containLabel: true
	},
    toolbox: {
        show : true,
        orient: 'vertical',
        x: 'right',
        y: 'center'
    },
    xAxis : [
        {
            type : 'category',
			boundaryGap: false,
            data : ['201912','202001','202002','202003','202004','202005'],
			axisLine:{
				lineStyle:{
					color:'rgba(240,199,37,0.5)'
				}
			},
            axisLabel :{
                interval:0,
				rotate:'45',
				color:'#c1cadf'
            }
        }
    ],
    yAxis : [
        {
            type : 'value',
			name: '(万)',
			nameTextStyle:{
				color:'#c1cadf',
				align:'right',
				lineHeight:10
			},
			axisLine:{
				lineStyle:{
					color:'rgba(240,199,37,0.5)'
				}
			},
            axisLabel :{
                interval:0,
				color:'#c1cadf'
            },
			splitLine: {
				show: false
			}
        }
    ],
    series : [
        {
            name:'总卡数',
            type:'line',
			smooth: true,
			symbolSize: 8,
			areaStyle: {
				color: new echarts.graphic.LinearGradient(0, 0, 0, 1, [{
					offset: 0,
					color: 'rgba(240,199,37,0.5)'
				}, {
					offset: 1,
					color: 'rgba(240,199,37,0.01)'
				}])
			},
            data:[127,224,120,278,227,237],
            barWidth: '30%',
            itemStyle:{ normal:{ color:'#f0c725' } }
        },{
            name:'使用中卡数',
            type:'line',
			smooth: true,
			symbolSize: 8,
			areaStyle: {
				color: new echarts.graphic.LinearGradient(0, 0, 0, 1, [{
					offset: 0,
					color: 'rgba(22,248,146,0.5)'
				}, {
					offset: 1,
					color: 'rgba(22,248,146,0.01)'
				}])
			},
            data:[27,124,70,178,127,157],
            barWidth: '30%',
            itemStyle:{ normal:{ color:'#16f892' } }
        }
    ]
}
END
上一篇 趋势图-人口脱贫完成情况趋势图
下一篇 趋势图-负面言论分领域趋势


