本站所有转载资源全部来源于本站会员,仅供下载学习与参考,请勿用于商业用途,下载学习试用后请于24小时内删除,如有条件请支持正版,如有侵权请联系删除,谢谢。
资源介绍
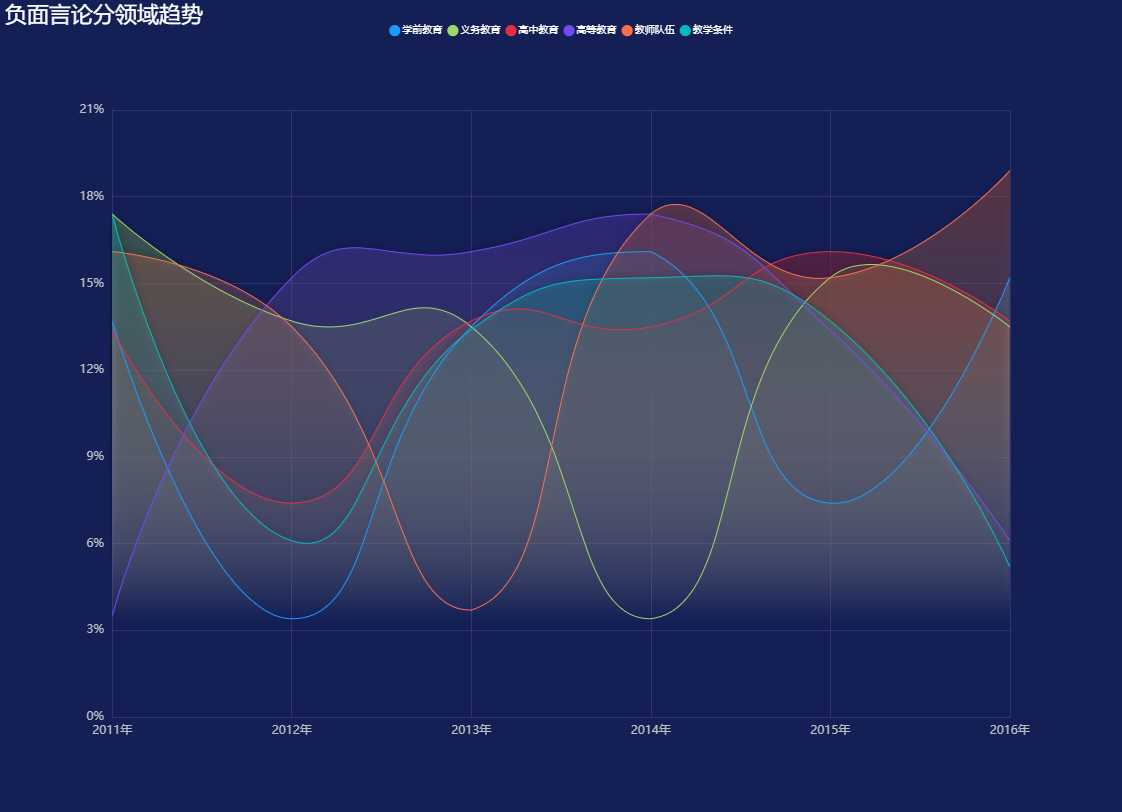
一、通用组件使用方式
1. 引入依赖
<!DOCTYPE html>
<html>
<head>
  <meta charset="utf-8">
  <meta name="viewport" content="width=device-width">
  <title>趋势图-负面言论分领域趋势</title>
</head>
<body>
<div id="chart" style="width: 100%;height:100%;"></div>
<script src="http://cdnjs.cloudflare.com/ajax/libs/echarts/4.8.0/echarts.min.js"></script>
</body>
</html>
2. 绘制图表
var myChart = echarts.init(document.getElementById('chart'));

var option;

var xData = function() {
    var data = [];
    for (var i = 2011; i < 2017; i++) {
        data.push(i + "年");
    }
    return data;
}();
var color = ['#1a9bfc', '#99da69', '#e32f46', '#7049f0', '#fa704d', '#01babc', ]
var name = ['学前教育', '义务教育', '高中教育', '高等教育', '教师队伍', '教学条件']
var data = [
    [13.7, 3.4, 13.5, 16.1, 7.4, 15.2],
    [17.4, 13.7, 13.5, 3.4, 15.2, 13.5],
    [13.4, 7.4, 13.7, 13.5, 16.1, 13.7],
    [3.5, 15.2, 16.1, 17.4, 13.4, 6.1],
    [16.1, 13.5, 3.7, 17.4, 15.2, 18.9],
    [17.4, 6.1, 13.4, 15.2, 13.7, 5.2],
]

var series = [];
for (var i = 0; i < 6; i++) {
    series.push({
        name: name[i],
        type: "line",
        symbolSize: 3,//标记的大小,可以设置成诸如 10 这样单一的数字,也可以用数组分开表示宽和高,例如 [20, 10] 表示标记宽为20,高为10[ default: 4 ]
        symbol: 'circle',//标记的图形。ECharts 提供的标记类型包括 'circle', 'rect', 'roundRect', 'triangle', 'diamond', 'pin', 'arrow'
        smooth: true, //是否平滑曲线显示
        showSymbol: false, //是否显示 symbol, 如果 false 则只有在 tooltip hover 的时候显示
        areaStyle: {
            normal: {
                color: new echarts.graphic.LinearGradient(0, 0, 0, 1, [{
                    offset: 0,
                    color: color[i]
                }, {
                    offset: 0.8,
                    color: 'rgba(255,255,255,0)'
                }], false),
                // shadowColor: 'rgba(255,255,255, 0.1)',
                shadowBlur: 10,
                opacity:0.3,
            }
        },
        itemStyle: {
            normal: {
                color: color[i],
                lineStyle: {
                    width: 1,
                    type: 'solid' //'dotted'虚线 'solid'实线
                },
                borderColor: color[i], //图形的描边颜色。支持的格式同 color
                borderWidth: 8 ,//描边线宽。为 0 时无描边。[ default: 0 ]
                barBorderRadius: 0,
                label: {
                    show: false,
                },
                opacity:0.5,
            }
        },
        data: data[i],

    })
}
option = {
    backgroundColor: "#141f56",
    legend: {
        top: 20,
            itemGap:5,
            itemWidth:5,
            textStyle: {
                color: '#fff',
                fontSize: '10'
            },
            data: name
    },
    title: {
        text: "负面言论分领域趋势",
        textStyle: {
            color: '#fff',
            fontSize: '22',
            fontWeight: 'normal',
        },
        subtextStyle: {
            color: '#90979c',
            fontSize: '16',

        },
    },
    tooltip: {
        trigger: "axis",
        axisPointer: { // 坐标轴指示器,坐标轴触发有效
            type: 'line', // 默认为直线,可选为:'line' | 'shadow'
            lineStyle: {
                color: '#57617B'
            }
        },
        formatter: '{b}<br />{a0}: {c0}%<br />{a1}: {c1}%<br />{a2}: {c2}%<br />{a3}: {c3}%<br />{a4}: {c4}%<br />{a5}: {c5}%',
        backgroundColor: 'rgba(0,0,0,0.7)', // 背景
        padding: [8, 10], //内边距
        extraCssText: 'box-shadow: 0 0 3px rgba(255, 255, 255, 0.4);', //添加阴影
    },
    grid: {
        borderWidth: 0,
        top: 110,
        bottom: 95,
        textStyle: {
            color: "#fff"
        }
    },
    xAxis: [{
        type: "category",
        axisLine: {
            lineStyle: {
                color: '#32346c'
            }
        },
        splitLine: {
            show: true,
            lineStyle: {
                color: '#32346c ',
            }
        },
        boundaryGap: false, //坐标轴两边留白策略,类目轴和非类目轴的设置和表现不一样
        axisTick: {
            show: false
        },
        splitArea: {
            show: false
        },
        axisLabel: {
            inside: false,
            textStyle: {
                color: '#bac0c0',
                fontWeight: 'normal',
                fontSize: '12',
            },
        },
        data: xData,
    }],
    yAxis: {
        type: 'value',
        axisTick: {
            show: false
        },
        axisLine: {
            show: true,
            lineStyle: {
                color: '#32346c',
            }
        },
        splitLine: {
            show: true,
            lineStyle: {
                color: '#32346c ',
            }
        },
        axisLabel: {
            textStyle: {
                color: '#bac0c0',
                fontWeight: 'normal',
                fontSize: '12',
            },
            formatter: '{value}%',
        },
    },
    series: series,
}

myChart.setOption(option);
3. 生成的Option配置
{
	"backgroundColor": "#141f56",
	"legend": {
		"top": 20,
		"itemGap": 5,
		"itemWidth": 5,
		"textStyle": {
			"color": "#fff",
			"fontSize": "10"
		},
		"data": ["学前教育", "义务教育", "高中教育", "高等教育", "教师队伍", "教学条件"]
	},
	"title": {
		"text": "负面言论分领域趋势",
		"textStyle": {
			"color": "#fff",
			"fontSize": "22",
			"fontWeight": "normal"
		},
		"subtextStyle": {
			"color": "#90979c",
			"fontSize": "16"
		}
	},
	"tooltip": {
		"trigger": "axis",
		"axisPointer": {
			"type": "line",
			"lineStyle": {
				"color": "#57617B"
			}
		},
		"formatter": "{b}<br />{a0}: {c0}%<br />{a1}: {c1}%<br />{a2}: {c2}%<br />{a3}: {c3}%<br />{a4}: {c4}%<br />{a5}: {c5}%",
		"backgroundColor": "rgba(0,0,0,0.7)",
		"padding": [8, 10],
		"extraCssText": "box-shadow: 0 0 3px rgba(255, 255, 255, 0.4);"
	},
	"grid": {
		"borderWidth": 0,
		"top": 110,
		"bottom": 95,
		"textStyle": {
			"color": "#fff"
		}
	},
	"xAxis": [{
		"type": "category",
		"axisLine": {
			"lineStyle": {
				"color": "#32346c"
			}
		},
		"splitLine": {
			"show": true,
			"lineStyle": {
				"color": "#32346c "
			}
		},
		"boundaryGap": false,
		"axisTick": {
			"show": false
		},
		"splitArea": {
			"show": false
		},
		"axisLabel": {
			"inside": false,
			"textStyle": {
				"color": "#bac0c0",
				"fontWeight": "normal",
				"fontSize": "12"
			}
		},
		"data": ["2011年", "2012年", "2013年", "2014年", "2015年", "2016年"]
	}],
	"yAxis": {
		"type": "value",
		"axisTick": {
			"show": false
		},
		"axisLine": {
			"show": true,
			"lineStyle": {
				"color": "#32346c"
			}
		},
		"splitLine": {
			"show": true,
			"lineStyle": {
				"color": "#32346c "
			}
		},
		"axisLabel": {
			"textStyle": {
				"color": "#bac0c0",
				"fontWeight": "normal",
				"fontSize": "12"
			},
			"formatter": "{value}%"
		}
	},
	"series": [{
		"name": "学前教育",
		"type": "line",
		"symbolSize": 3,
		"symbol": "circle",
		"smooth": true,
		"showSymbol": false,
		"areaStyle": {
			"normal": {
				"color": {
					"x": 0,
					"y": 0,
					"x2": 0,
					"y2": 1,
					"type": "linear",
					"global": false,
					"colorStops": [{
						"offset": 0,
						"color": "#1a9bfc"
					}, {
						"offset": 0.8,
						"color": "rgba(255,255,255,0)"
					}]
				},
				"shadowBlur": 10,
				"opacity": 0.3
			}
		},
		"itemStyle": {
			"normal": {
				"color": "#1a9bfc",
				"lineStyle": {
					"width": 1,
					"type": "solid"
				},
				"borderColor": "#1a9bfc",
				"borderWidth": 8,
				"barBorderRadius": 0,
				"label": {
					"show": false
				},
				"opacity": 0.5
			}
		},
		"data": [13.7, 3.4, 13.5, 16.1, 7.4, 15.2]
	}, {
		"name": "义务教育",
		"type": "line",
		"symbolSize": 3,
		"symbol": "circle",
		"smooth": true,
		"showSymbol": false,
		"areaStyle": {
			"normal": {
				"color": {
					"x": 0,
					"y": 0,
					"x2": 0,
					"y2": 1,
					"type": "linear",
					"global": false,
					"colorStops": [{
						"offset": 0,
						"color": "#99da69"
					}, {
						"offset": 0.8,
						"color": "rgba(255,255,255,0)"
					}]
				},
				"shadowBlur": 10,
				"opacity": 0.3
			}
		},
		"itemStyle": {
			"normal": {
				"color": "#99da69",
				"lineStyle": {
					"width": 1,
					"type": "solid"
				},
				"borderColor": "#99da69",
				"borderWidth": 8,
				"barBorderRadius": 0,
				"label": {
					"show": false
				},
				"opacity": 0.5
			}
		},
		"data": [17.4, 13.7, 13.5, 3.4, 15.2, 13.5]
	}, {
		"name": "高中教育",
		"type": "line",
		"symbolSize": 3,
		"symbol": "circle",
		"smooth": true,
		"showSymbol": false,
		"areaStyle": {
			"normal": {
				"color": {
					"x": 0,
					"y": 0,
					"x2": 0,
					"y2": 1,
					"type": "linear",
					"global": false,
					"colorStops": [{
						"offset": 0,
						"color": "#e32f46"
					}, {
						"offset": 0.8,
						"color": "rgba(255,255,255,0)"
					}]
				},
				"shadowBlur": 10,
				"opacity": 0.3
			}
		},
		"itemStyle": {
			"normal": {
				"color": "#e32f46",
				"lineStyle": {
					"width": 1,
					"type": "solid"
				},
				"borderColor": "#e32f46",
				"borderWidth": 8,
				"barBorderRadius": 0,
				"label": {
					"show": false
				},
				"opacity": 0.5
			}
		},
		"data": [13.4, 7.4, 13.7, 13.5, 16.1, 13.7]
	}, {
		"name": "高等教育",
		"type": "line",
		"symbolSize": 3,
		"symbol": "circle",
		"smooth": true,
		"showSymbol": false,
		"areaStyle": {
			"normal": {
				"color": {
					"x": 0,
					"y": 0,
					"x2": 0,
					"y2": 1,
					"type": "linear",
					"global": false,
					"colorStops": [{
						"offset": 0,
						"color": "#7049f0"
					}, {
						"offset": 0.8,
						"color": "rgba(255,255,255,0)"
					}]
				},
				"shadowBlur": 10,
				"opacity": 0.3
			}
		},
		"itemStyle": {
			"normal": {
				"color": "#7049f0",
				"lineStyle": {
					"width": 1,
					"type": "solid"
				},
				"borderColor": "#7049f0",
				"borderWidth": 8,
				"barBorderRadius": 0,
				"label": {
					"show": false
				},
				"opacity": 0.5
			}
		},
		"data": [3.5, 15.2, 16.1, 17.4, 13.4, 6.1]
	}, {
		"name": "教师队伍",
		"type": "line",
		"symbolSize": 3,
		"symbol": "circle",
		"smooth": true,
		"showSymbol": false,
		"areaStyle": {
			"normal": {
				"color": {
					"x": 0,
					"y": 0,
					"x2": 0,
					"y2": 1,
					"type": "linear",
					"global": false,
					"colorStops": [{
						"offset": 0,
						"color": "#fa704d"
					}, {
						"offset": 0.8,
						"color": "rgba(255,255,255,0)"
					}]
				},
				"shadowBlur": 10,
				"opacity": 0.3
			}
		},
		"itemStyle": {
			"normal": {
				"color": "#fa704d",
				"lineStyle": {
					"width": 1,
					"type": "solid"
				},
				"borderColor": "#fa704d",
				"borderWidth": 8,
				"barBorderRadius": 0,
				"label": {
					"show": false
				},
				"opacity": 0.5
			}
		},
		"data": [16.1, 13.5, 3.7, 17.4, 15.2, 18.9]
	}, {
		"name": "教学条件",
		"type": "line",
		"symbolSize": 3,
		"symbol": "circle",
		"smooth": true,
		"showSymbol": false,
		"areaStyle": {
			"normal": {
				"color": {
					"x": 0,
					"y": 0,
					"x2": 0,
					"y2": 1,
					"type": "linear",
					"global": false,
					"colorStops": [{
						"offset": 0,
						"color": "#01babc"
					}, {
						"offset": 0.8,
						"color": "rgba(255,255,255,0)"
					}]
				},
				"shadowBlur": 10,
				"opacity": 0.3
			}
		},
		"itemStyle": {
			"normal": {
				"color": "#01babc",
				"lineStyle": {
					"width": 1,
					"type": "solid"
				},
				"borderColor": "#01babc",
				"borderWidth": 8,
				"barBorderRadius": 0,
				"label": {
					"show": false
				},
				"opacity": 0.5
			}
		},
		"data": [17.4, 6.1, 13.4, 15.2, 13.7, 5.2]
	}]
}
END
上一篇 趋势图-近6个月卡数增长趋势
下一篇 趋势图-未来一周气温变化趋势


