趋势图-未来一周气温变化趋势免费

资料收集者 130 2021-05-18 组件库
本站所有转载资源全部来源于本站会员,仅供下载学习与参考,请勿用于商业用途,下载学习试用后请于24小时内删除,如有条件请支持正版,如有侵权请联系删除,谢谢。

资源介绍
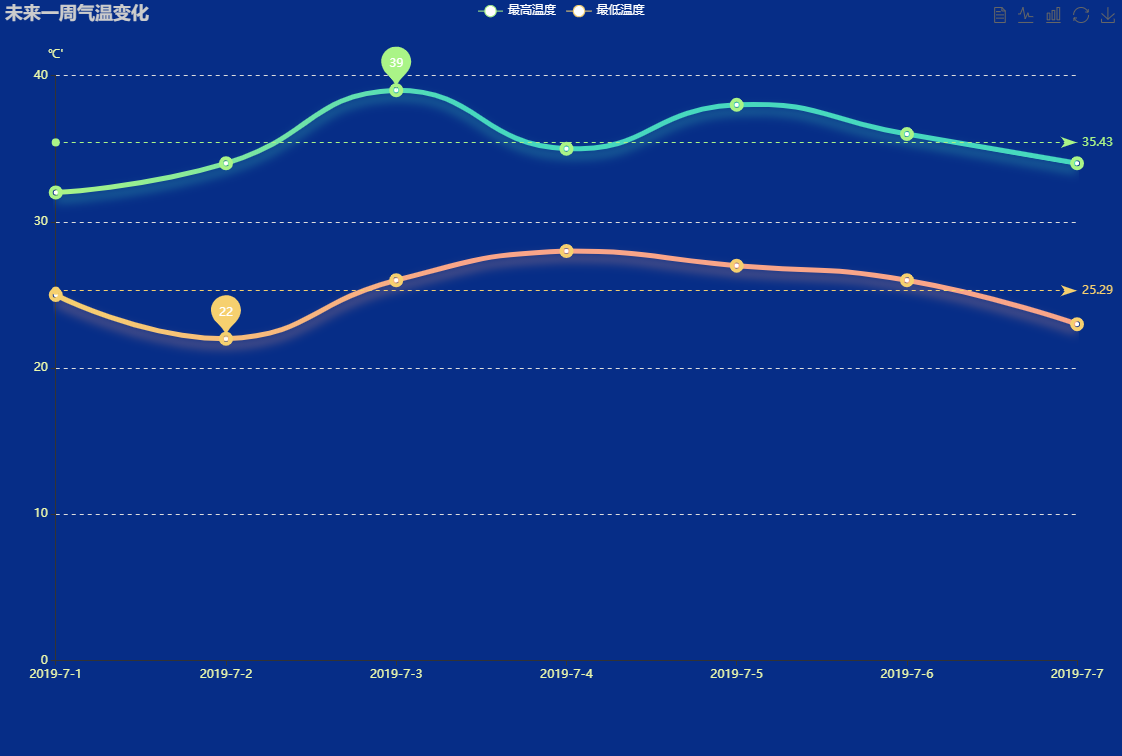
趋势图-未来一周气温变化趋势 (http://39.101.138.43:8090/) 组件库 第1张

一、通用组件使用方式

1. 引入依赖

<!DOCTYPE html>
<html>
<head>
  <meta charset="utf-8">
  <meta name="viewport" content="width=device-width">
  <title>趋势图-未来一周气温变化趋势</title>
</head>
<body>
<div id="chart" style="width: 100%;height:100%;"></div>
<script src="http://cdnjs.cloudflare.com/ajax/libs/echarts/4.8.0/echarts.min.js"></script>
</body>
</html>

2. 绘制图表

var myChart = echarts.init(document.getElementById('chart'));

var option;

option = {
  backgroundColor:'#062D87',
    title : {
        text: '未来一周气温变化',
        textStyle:{
            color:"#ccc"
        }
    },
    tooltip : {
        trigger: 'axis'
    },
    legend: {
        data:['最高温度','最低温度'],
      textStyle:{
      color:"#fff"
      }
    },
    grid: {
        top: 'middle',
        left: '3%',
        right: '4%',
        bottom: '3%',
        height: '80%',
        containLabel: true
    },
    toolbox: {
        show : true,
        feature : {
            mark : {show: true},
            dataView : {show: true, readOnly: false},
            magicType : {show: true, type: ['line', 'bar']},
            restore : {show: true},
            saveAsImage : {show: true}
        }
    },
    calculable : true,
    xAxis : [
        {
            type : 'category',
            boundaryGap : false,
            data : ['2019-7-1','2019-7-2','2019-7-3','2019-7-4','2019-7-5','2019-7-6','2019-7-7'],
          axisTick: {
            show: true //隐藏X轴刻度
        },
        axisLabel: {
            show: true,
            textStyle: {
                color: "#ebf8ac" //X轴文字颜色
            }
        },
        }
    ],
    yAxis : [
        {
            type : 'value',
            name:"℃'",
            nameTextStyle: {
                color: "#ebf8ac"
               },           
               axisLabel : {
                formatter: '{value}℃'
            },
           axisLabel: {
                show: true,
                textStyle: {
                    color: "#ebf8ac"
                }
            },
            splitLine: {
            lineStyle: {
                type: 'dashed',
                color: '#DDD'
            }
        },
        }
    ],
    series : [
        {
            name:'最高温度',
            type:'line',
            min:10,
            max:40,
            data:[32, 34, 39, 35, 38, 36, 34],
            markPoint : {
                data : [
                    {name : '周最高', value : 39, xAxis: 2, yAxis: 39}
                ]
            },
           lineStyle: {
                normal: {
                    width: 5,
                    color: {
                        type: 'linear',

                        colorStops: [{
                                offset: 0,
                                color: '#AAF487' // 0% 处的颜色
                            },
                            {
                                offset: 0.4,
                                color: '#47D8BE' // 100% 处的颜色
                            }, {
                                offset: 1,
                                color: '#47D8BE' // 100% 处的颜色
                            }
                        ],
                        globalCoord: false // 缺省为 false
                    },
                    shadowColor: 'rgba(71,216,190, 0.5)',
                    shadowBlur: 10,
                    shadowOffsetY: 7
                }
            },
            itemStyle: {
                normal: {
                    color: '#AAF487',
                    borderWidth: 10,
                    /*shadowColor: 'rgba(72,216,191, 0.3)',
                     shadowBlur: 100,*/
                    borderColor: "#AAF487"
                }
            },
            smooth: true,
            markLine : {
                data : [
                    {type : 'average', name: '平均值'}
                ]
            }
        },
        {
            name:'最低温度',
            type:'line',
             min:10,
            max:40,
            data:[25, 22, 26, 28, 27, 26, 23],
            markPoint : {
                data : [
                    {name : '周最低', value : 22, xAxis: 1, yAxis: 22}
                ]
            },
            lineStyle: {
                normal: {
                    width: 5,
                    color: {
                        type: 'linear',

                        colorStops: [{
                                offset: 0,
                                color: '#F6D06F' // 0% 处的颜色
                            },
                            {
                                offset: 0.4,
                                color: '#F9A589' // 100% 处的颜色
                            }, {
                                offset: 1,
                                color: '#F9A589' // 100% 处的颜色
                            }
                        ],
                        globalCoord: false // 缺省为 false
                    },
                    shadowColor: 'rgba(249,165,137, 0.5)',
                    shadowBlur: 10,
                    shadowOffsetY: 7
                }
            },
            itemStyle: {
                normal: {
                    color: '#F6D06F',
                    borderWidth: 10,
                    /*shadowColor: 'rgba(72,216,191, 0.3)',
                     shadowBlur: 100,*/
                    borderColor: "#F6D06F"
                }
            },
             smooth: true,
            markLine : {
                data : [
                    {type : 'average', name : '平均值'}
                ]
            }
        }
    ]
};
                    

myChart.setOption(option);

3. 生成的Option配置

{
  backgroundColor:'#062D87',
    title : {
        text: '未来一周气温变化',
        textStyle:{
            color:"#ccc"
        }
    },
    tooltip : {
        trigger: 'axis'
    },
    legend: {
        data:['最高温度','最低温度'],
      textStyle:{
      color:"#fff"
      }
    },
    grid: {
        top: 'middle',
        left: '3%',
        right: '4%',
        bottom: '3%',
        height: '80%',
        containLabel: true
    },
    toolbox: {
        show : true,
        feature : {
            mark : {show: true},
            dataView : {show: true, readOnly: false},
            magicType : {show: true, type: ['line', 'bar']},
            restore : {show: true},
            saveAsImage : {show: true}
        }
    },
    calculable : true,
    xAxis : [
        {
            type : 'category',
            boundaryGap : false,
            data : ['2019-7-1','2019-7-2','2019-7-3','2019-7-4','2019-7-5','2019-7-6','2019-7-7'],
          axisTick: {
            show: true //隐藏X轴刻度
        },
        axisLabel: {
            show: true,
            textStyle: {
                color: "#ebf8ac" //X轴文字颜色
            }
        },
        }
    ],
    yAxis : [
        {
            type : 'value',
            name:"℃'",
            nameTextStyle: {
                color: "#ebf8ac"
               },           
               axisLabel : {
                formatter: '{value}℃'
            },
           axisLabel: {
                show: true,
                textStyle: {
                    color: "#ebf8ac"
                }
            },
            splitLine: {
            lineStyle: {
                type: 'dashed',
                color: '#DDD'
            }
        },
        }
    ],
    series : [
        {
            name:'最高温度',
            type:'line',
            min:10,
            max:40,
            data:[32, 34, 39, 35, 38, 36, 34],
            markPoint : {
                data : [
                    {name : '周最高', value : 39, xAxis: 2, yAxis: 39}
                ]
            },
           lineStyle: {
                normal: {
                    width: 5,
                    color: {
                        type: 'linear',

                        colorStops: [{
                                offset: 0,
                                color: '#AAF487' // 0% 处的颜色
                            },
                            {
                                offset: 0.4,
                                color: '#47D8BE' // 100% 处的颜色
                            }, {
                                offset: 1,
                                color: '#47D8BE' // 100% 处的颜色
                            }
                        ],
                        globalCoord: false // 缺省为 false
                    },
                    shadowColor: 'rgba(71,216,190, 0.5)',
                    shadowBlur: 10,
                    shadowOffsetY: 7
                }
            },
            itemStyle: {
                normal: {
                    color: '#AAF487',
                    borderWidth: 10,
                    /*shadowColor: 'rgba(72,216,191, 0.3)',
                     shadowBlur: 100,*/
                    borderColor: "#AAF487"
                }
            },
            smooth: true,
            markLine : {
                data : [
                    {type : 'average', name: '平均值'}
                ]
            }
        },
        {
            name:'最低温度',
            type:'line',
             min:10,
            max:40,
            data:[25, 22, 26, 28, 27, 26, 23],
            markPoint : {
                data : [
                    {name : '周最低', value : 22, xAxis: 1, yAxis: 22}
                ]
            },
            lineStyle: {
                normal: {
                    width: 5,
                    color: {
                        type: 'linear',

                        colorStops: [{
                                offset: 0,
                                color: '#F6D06F' // 0% 处的颜色
                            },
                            {
                                offset: 0.4,
                                color: '#F9A589' // 100% 处的颜色
                            }, {
                                offset: 1,
                                color: '#F9A589' // 100% 处的颜色
                            }
                        ],
                        globalCoord: false // 缺省为 false
                    },
                    shadowColor: 'rgba(249,165,137, 0.5)',
                    shadowBlur: 10,
                    shadowOffsetY: 7
                }
            },
            itemStyle: {
                normal: {
                    color: '#F6D06F',
                    borderWidth: 10,
                    /*shadowColor: 'rgba(72,216,191, 0.3)',
                     shadowBlur: 100,*/
                    borderColor: "#F6D06F"
                }
            },
             smooth: true,
            markLine : {
                data : [
                    {type : 'average', name : '平均值'}
                ]
            }
        }
    ]
}

END
相关标签

发表评论