本站所有转载资源全部来源于本站会员,仅供下载学习与参考,请勿用于商业用途,下载学习试用后请于24小时内删除,如有条件请支持正版,如有侵权请联系删除,谢谢。
资源介绍
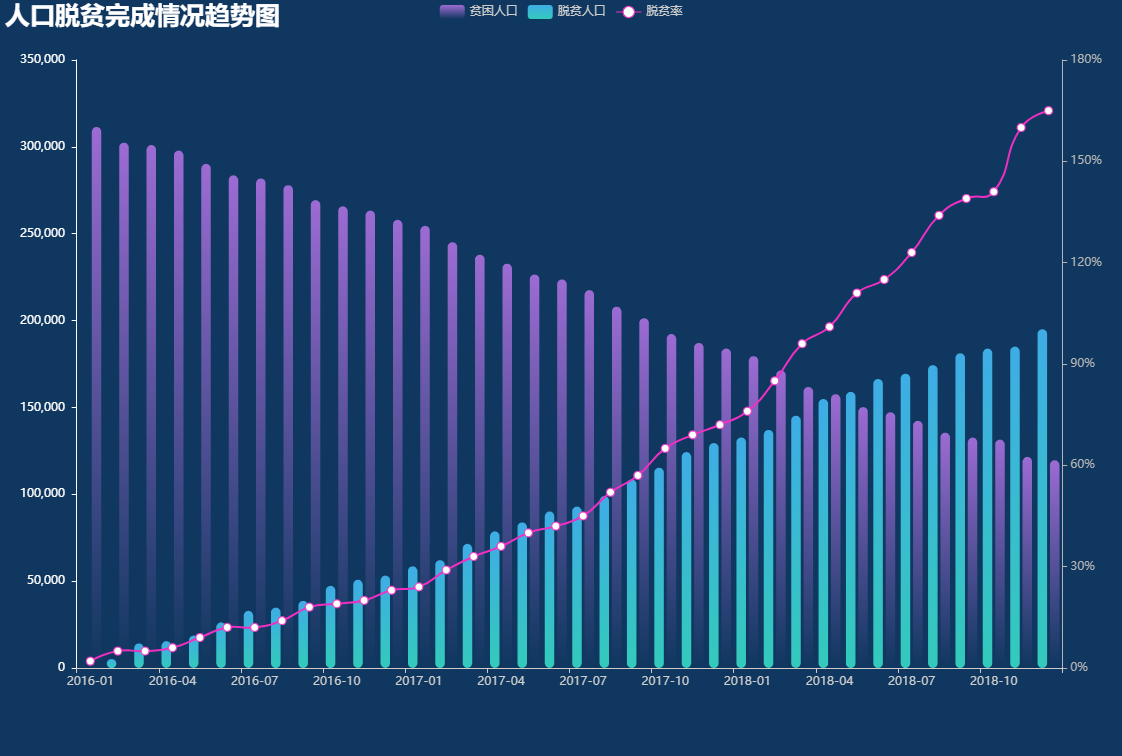
一、通用组件使用方式
1. 引入依赖
<!DOCTYPE html>
<html>
<head>
  <meta charset="utf-8">
  <meta name="viewport" content="width=device-width">
  <title>趋势图-人口脱贫完成情况趋势图</title>
</head>
<body>
<div id="chart" style="width: 100%;height:100%;"></div>
<script src="http://cdnjs.cloudflare.com/ajax/libs/echarts/4.8.0/echarts.min.js"></script>
</body>
</html>
2. 绘制图表
var myChart = echarts.init(document.getElementById('chart'));

var option;

// Generate data
var category = []; //年月
var lineData = []; //贫困人口
var barData = [0]; //脱贫人口
var rateData = []; //脱贫率

var total = 316532;
var data = new Date('2018-12-1');
var year = data.getFullYear();
data.setMonth(data.getMonth() + 1, 1) //获取到当前月份,设置月份
for (var i = 0; i < 36; i++) {
    data.setMonth(data.getMonth() - 1); //每次循环一次 月份值减1
    var m = data.getMonth() + 1;
    m = m < 10 ? "0" + m : m;
    category.push(data.getFullYear() + "-" + (m));
    var b = barData[i] + parseInt(Math.random() * 10000);
    barData.push(b);
    lineData.push(total - b);
    rateData.push((b / (total - b)).toFixed(2) * 100);
}
category.reverse();

// option
option = {
    title: {
        text: '人口脱贫完成情况趋势图',
        textStyle: {
            color: '#fff',
            fontSize: 25
        }
    },
    backgroundColor: '#0f375f',
    tooltip: {
        trigger: 'axis',
        axisPointer: {
            type: 'shadow',
            label: {
                show: true,
                backgroundColor: '#333'
            }
        }
    },
    legend: {
        data: ['贫困人口', '脱贫人口', '脱贫率'],
        textStyle: {
            color: '#ccc'
        }
    },
    grid: {
        left: '20',
        right: '20',
        bottom: '9%',
        top: '60',
        containLabel: true
    },
    xAxis: {
        data: category,
        axisLine: {
            lineStyle: {
                color: '#ccc'
            }
        }
    },
    yAxis: [{
            splitLine: {
                show: false
            },
            axisLine: {
                lineStyle: {
                    color: '#ffffff',
                }
            },
            axisLabel: {
                formatter: '{value} ',
            }
        },
        {
            splitLine: {
                show: false
            },
            axisLine: {
                lineStyle: {
                    color: '#B4B4B4',
                }
            },
            axisLabel: {
                formatter: function(value) {
                    return value + '%';
                }
            }
        }
    ],
    series: [{
            name: '脱贫率',
            type: 'line',
            smooth: true,
            showAllSymbol: true,
            symbol: 'emptyCircle',
            symbolSize: 8,
            yAxisIndex: 1,
            itemStyle: {
                normal: {
                    color: '#F02FC2'
                },
            },
            data: rateData
        },
        {
            name: '脱贫人口',
            type: 'bar',
            itemStyle: {
                normal: {
                    barBorderRadius: 5,
                    //颜色渐变
                    color: new echarts.graphic.LinearGradient(
                        0, 0, 0, 1,
                        [{
                                offset: 1,
                                color: '#33cabb'
                            },
                            {
                                offset: 0,
                                color: '#3EACE5'
                            }
                        ]
                    )
                }
            },
            data: barData,
        },

        {
            name: '贫困人口',
            type: 'bar',
            itemStyle: {
                normal: {
                    barBorderRadius: 5,
                    color: new echarts.graphic.LinearGradient(
                        0, 0, 0, 1,
                        [{
                                offset: 0,
                                color: 'rgba(156,107,211,1)'
                            },
                            // {offset: 0.2, color: 'rgba(156,107,211,0.5)'},
                            {
                                offset: 1,
                                color: 'rgba(156,107,211,0)'
                            }
                        ]
                    )
                }
            },
            data: lineData
        },
    ]
};

myChart.setOption(option);
3. 生成的Option配置
{
	"title": {
		"text": "人口脱贫完成情况趋势图",
		"textStyle": {
			"color": "#fff",
			"fontSize": 25
		}
	},
	"backgroundColor": "#0f375f",
	"tooltip": {
		"trigger": "axis",
		"axisPointer": {
			"type": "shadow",
			"label": {
				"show": true,
				"backgroundColor": "#333"
			}
		}
	},
	"legend": {
		"data": ["贫困人口", "脱贫人口", "脱贫率"],
		"textStyle": {
			"color": "#ccc"
		}
	},
	"grid": {
		"left": "20",
		"right": "20",
		"bottom": "9%",
		"top": "60",
		"containLabel": true
	},
	"xAxis": {
		"data": ["2016-01", "2016-02", "2016-03", "2016-04", "2016-05", "2016-06", "2016-07", "2016-08", "2016-09", "2016-10", "2016-11", "2016-12", "2017-01", "2017-02", "2017-03", "2017-04", "2017-05", "2017-06", "2017-07", "2017-08", "2017-09", "2017-10", "2017-11", "2017-12", "2018-01", "2018-02", "2018-03", "2018-04", "2018-05", "2018-06", "2018-07", "2018-08", "2018-09", "2018-10", "2018-11", "2018-12"],
		"axisLine": {
			"lineStyle": {
				"color": "#ccc"
			}
		}
	},
	"yAxis": [{
		"splitLine": {
			"show": false
		},
		"axisLine": {
			"lineStyle": {
				"color": "#ffffff"
			}
		},
		"axisLabel": {
			"formatter": "{value} "
		}
	}, {
		"splitLine": {
			"show": false
		},
		"axisLine": {
			"lineStyle": {
				"color": "#B4B4B4"
			}
		},
		"axisLabel": {}
	}],
	"series": [{
		"name": "脱贫率",
		"type": "line",
		"smooth": true,
		"showAllSymbol": true,
		"symbol": "emptyCircle",
		"symbolSize": 8,
		"yAxisIndex": 1,
		"itemStyle": {
			"normal": {
				"color": "#F02FC2"
			}
		},
		"data": [1, 1, 2, 4, 5, 8, 11, 14.000000000000002, 17, 20, 23, 24, 25, 26, 30, 34, 37, 38, 42, 48, 50, 51, 54, 61, 61, 63, 69, 70, 75, 82, 90, 92, 102, 111.00000000000001, 117, 117]
	}, {
		"name": "脱贫人口",
		"type": "bar",
		"itemStyle": {
			"normal": {
				"barBorderRadius": 5,
				"color": {
					"x": 0,
					"y": 0,
					"x2": 0,
					"y2": 1,
					"type": "linear",
					"global": false,
					"colorStops": [{
						"offset": 1,
						"color": "#33cabb"
					}, {
						"offset": 0,
						"color": "#3EACE5"
					}]
				}
			}
		},
		"data": [0, 1798, 4551, 7551, 11116, 16188, 22427, 30256, 39193, 46411, 52235, 58430, 60959, 63385, 66288, 73029, 79616, 86311, 87176, 93706, 102866, 104853, 106331, 111418, 119798, 119928, 122871, 128685, 130357, 136124, 142842, 150141, 151561, 160046, 166762, 170365, 170971]
	}, {
		"name": "贫困人口",
		"type": "bar",
		"itemStyle": {
			"normal": {
				"barBorderRadius": 5,
				"color": {
					"x": 0,
					"y": 0,
					"x2": 0,
					"y2": 1,
					"type": "linear",
					"global": false,
					"colorStops": [{
						"offset": 0,
						"color": "rgba(156,107,211,1)"
					}, {
						"offset": 1,
						"color": "rgba(156,107,211,0)"
					}]
				}
			}
		},
		"data": [314734, 311981, 308981, 305416, 300344, 294105, 286276, 277339, 270121, 264297, 258102, 255573, 253147, 250244, 243503, 236916, 230221, 229356, 222826, 213666, 211679, 210201, 205114, 196734, 196604, 193661, 187847, 186175, 180408, 173690, 166391, 164971, 156486, 149770, 146167, 145561]
	}]
}
END
上一篇 雷达-环形效果
下一篇 趋势图-近6个月卡数增长趋势


